 Improving your Azure Machine Learning model
In this example we start with a sample experiment from the Microsoft Azure Machine Learning Gallery: Regression: Demand estimation. In this example there are four models built, and compared, based the newly created features. We will explore whether standard operations could improve these samples models, inspired by the e-book Data Science in the Cloud with Azure Machine Learning and R of Stephen Elston. We haven’t used the suggested new features that depend on prior info which wasn’t always complete, but created some other variables, that could be created based on the available dataset. Observing the sample, there are basically two areas where we see quick possibilities for improvement: data cleaning and transformation and evaluation of the results.
Data cleaning and transformation
What kind of data are you dealing with? In this case it’s rental bike information over time. When dealing with time series, you might want to detrend your dependent variable (amount of rented bikes). You can also check for multicollinearity (see chapter 6: Econometrics): a very high correlation could cause problems for some types of predictive models. But please remember that correlation doesn’t mean causation! Standardizing your numeric features if they don’t have the same scale can also improve your results. Finally, check for outliers.
Evaluation of the results
If you check the results from the Evaluate Model box, the coefficients of determination are not that different, but please also check the errors:
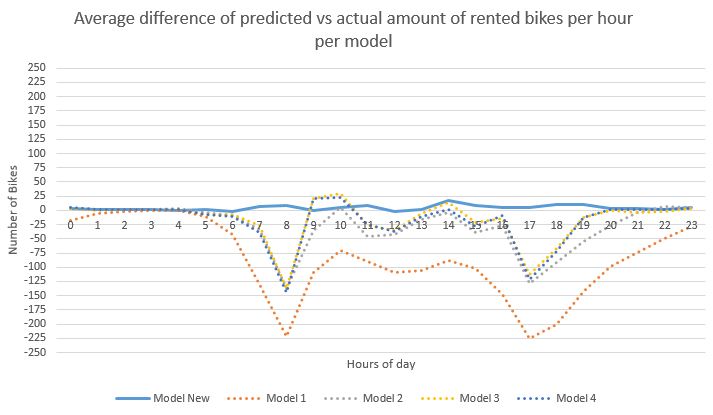
The information you don’t get from this step, is an overview of your predicted values regarding the original amounts. This can be realized with an R script. In this case, as we have information of bike renting per hour, it is recommended to check your results per hour as well. Here you can see where the models differ:
As you can observe, the original models have quite some peaks. Although we have to avoid overfitting, it seems that simple adjustments can give better results.


