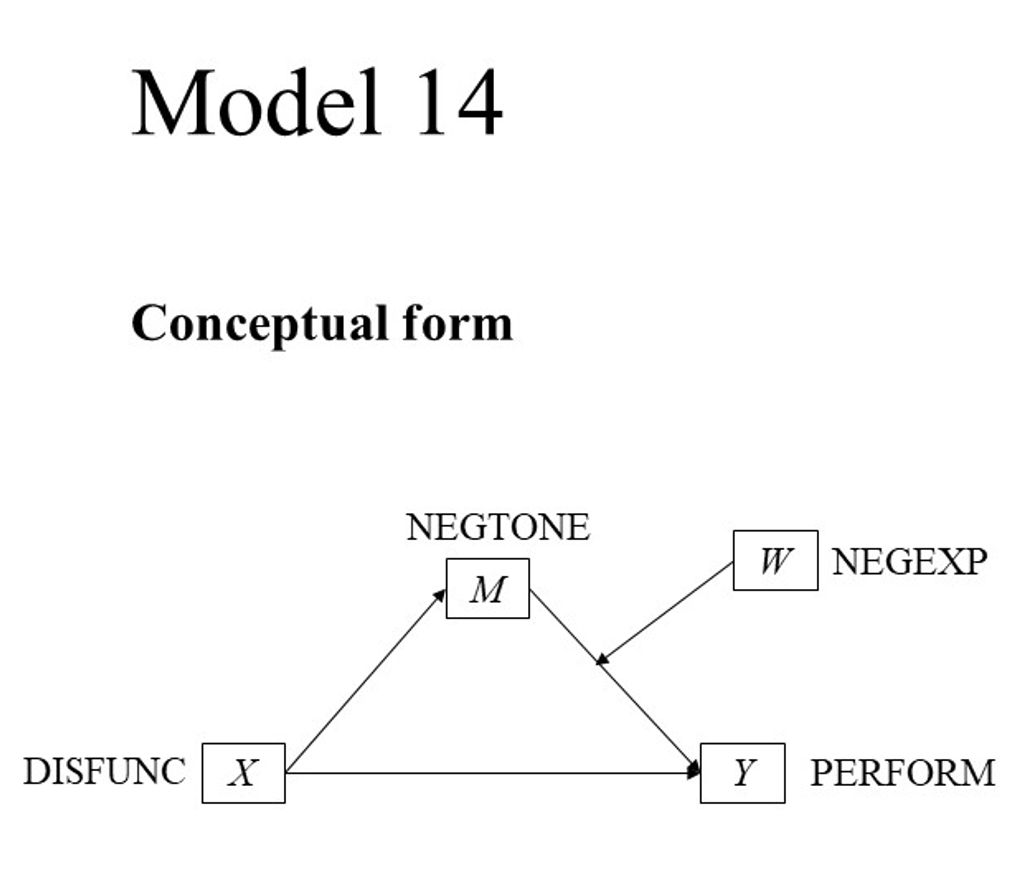
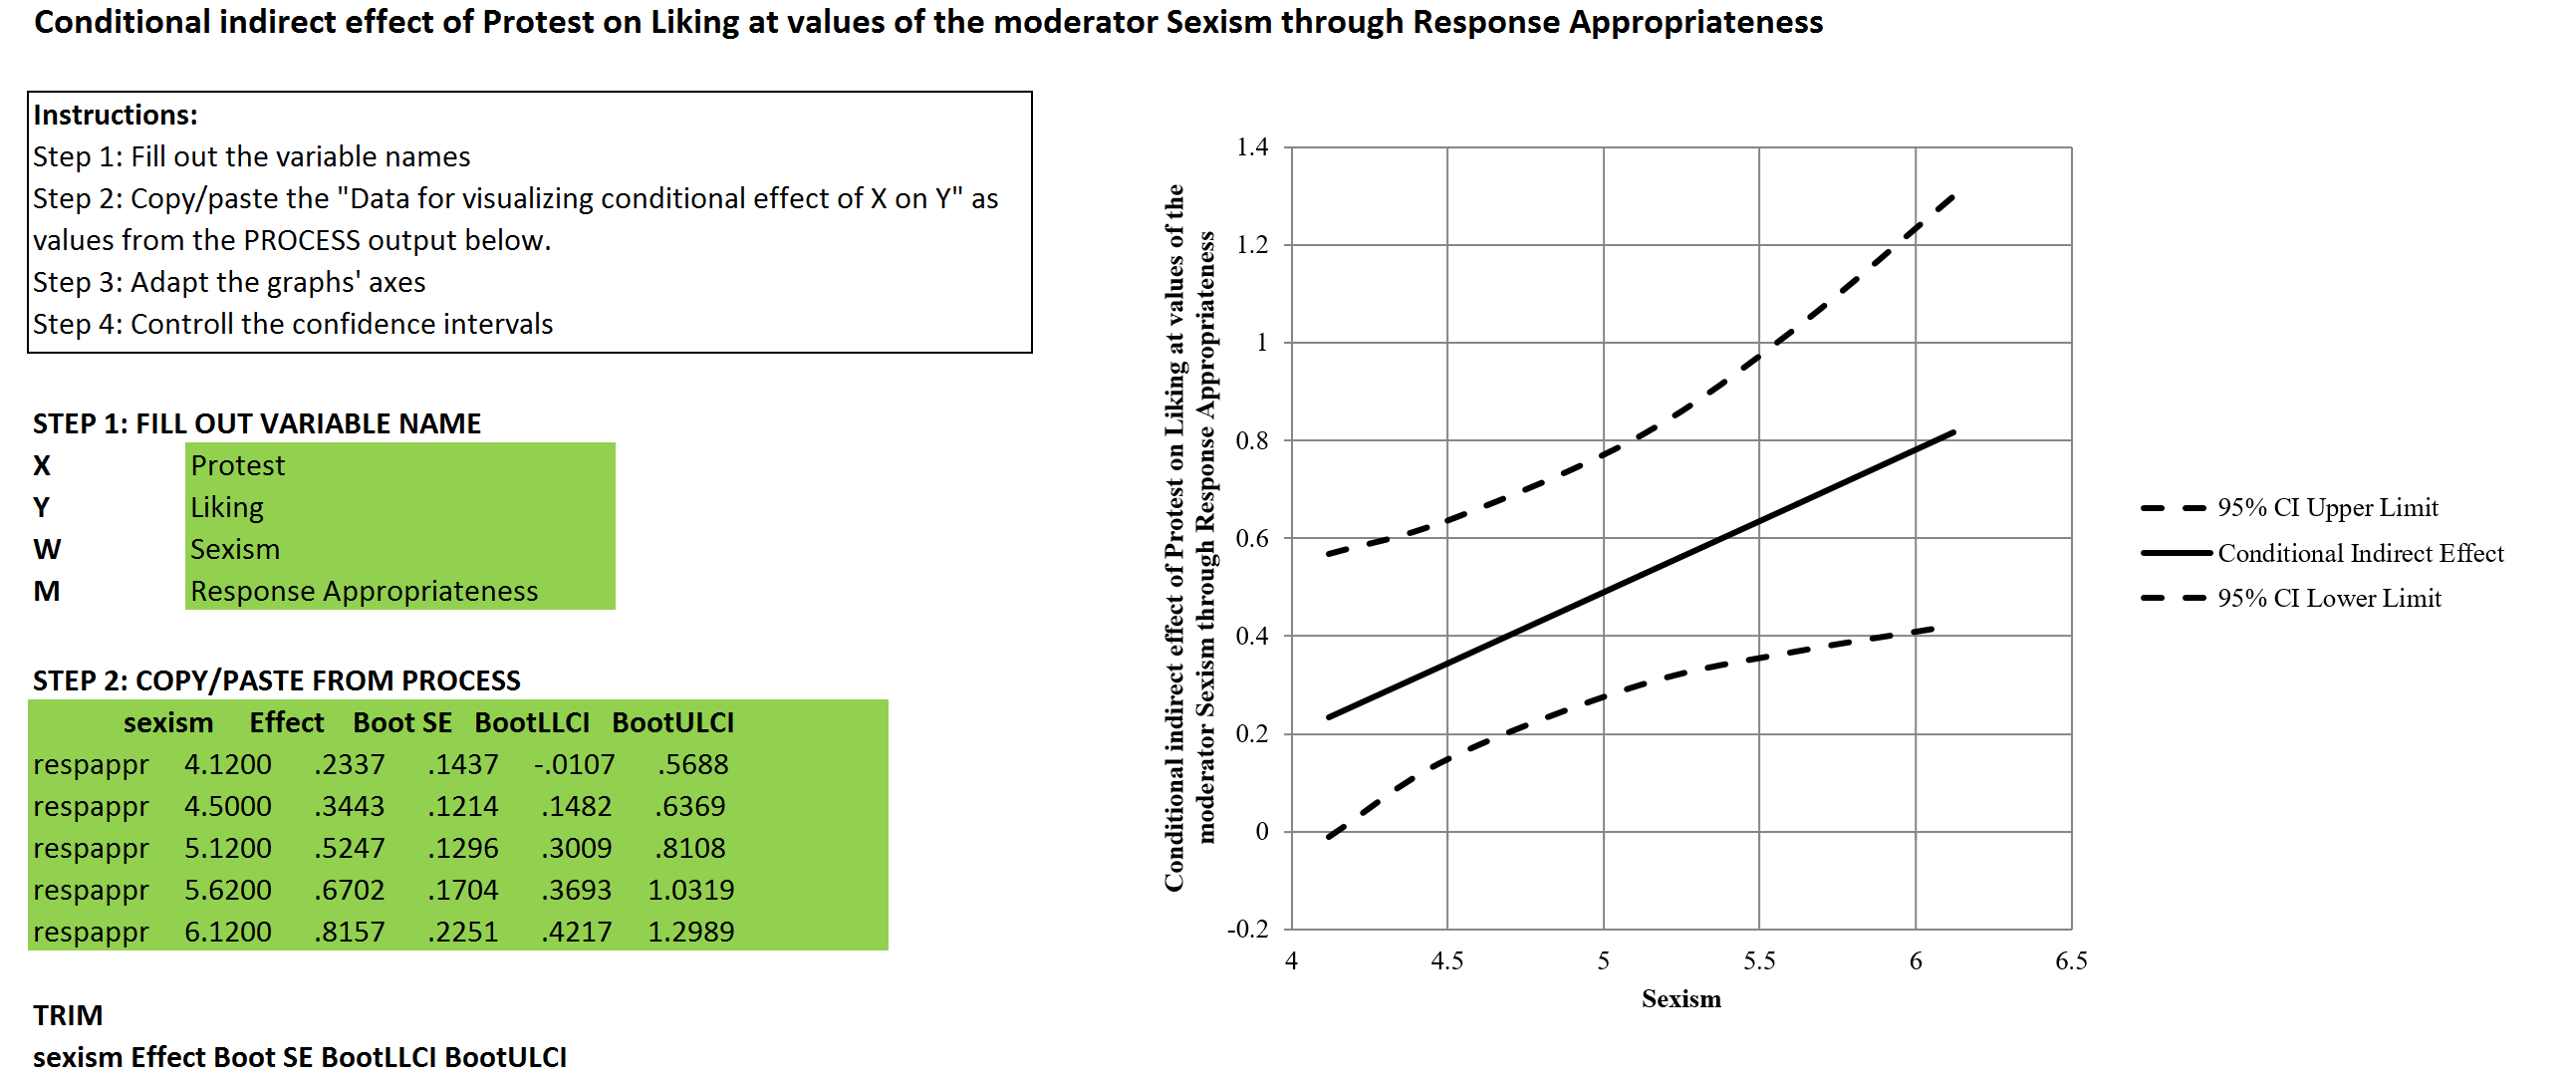
This tutorial is about graphing a moderated mediation model with PROCESS for R, with Hayes’s PROCESS source code, and my MD2C graphing template.
Continue reading “Graphing a moderated mediation model with PROCESS for R (Model 14)”Graphing a simple moderation model with PROCESS for R (Model 1)
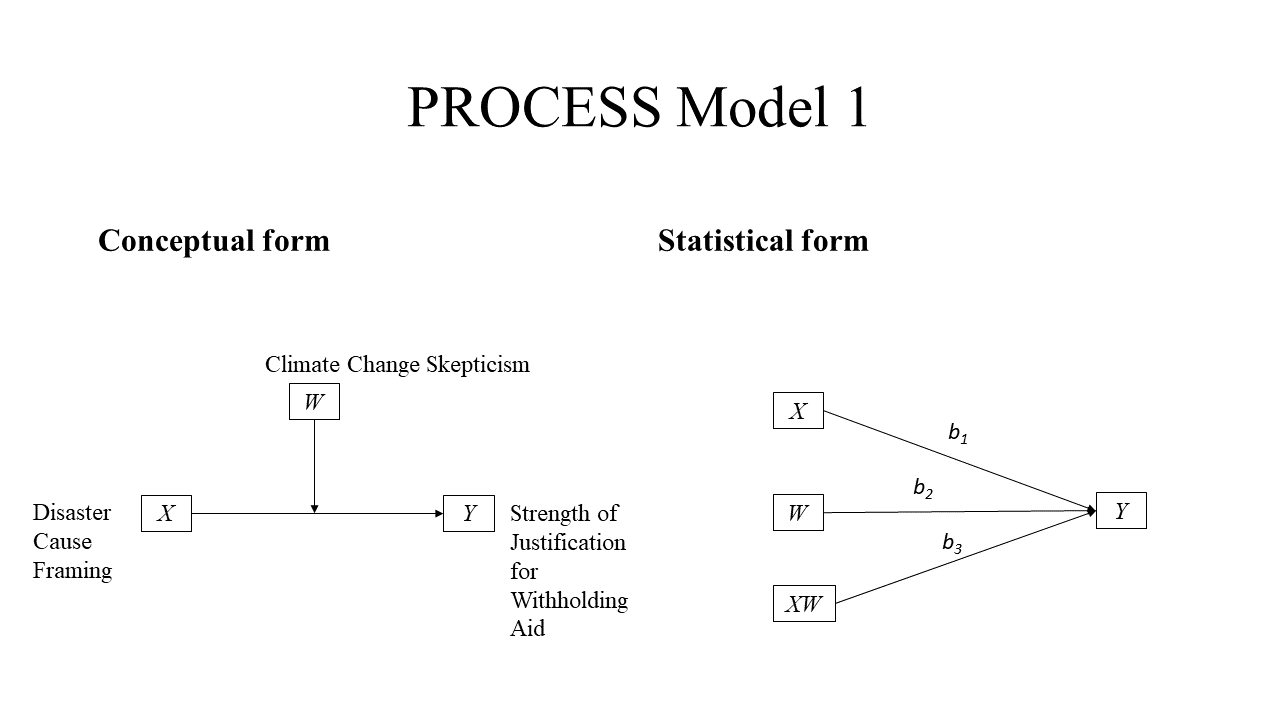
This tutorial is about graphing a simple moderation model with PROCESS for R, developed by Andrew Hayes, and my MD2C graphing template. There is a Github Repository for it as well, containing the R code.
Continue reading “Graphing a simple moderation model with PROCESS for R (Model 1)”Human Resources Analytics – Predict Employee Leave
Imagine you are an HR-Manager, and you would like to know which employees are likely to stay, and which might leave your company. Besides you would like to understand which factors contribute to leaving your company. You have gathered data in the past (well, in this case Kaggle simulated a dataset for you, but just imagine), and now you can start with this Hands On Lab – Predict Employee Leave to build your prediction model to see if that can help you.
In this lab, you will learn how to create a machine learning module that predicts whether an employee will stay or leave your company. We are aware of the limitations of the dataset but the objective of this hands on lab is to inspire you to explore the possibilities of using machine learning for your own research, and not to build the next HR-solution.
We created a starting experiment for you on the Azure AI Gallery to give you a smooth start. Continue reading “Human Resources Analytics – Predict Employee Leave”
Graphing moderation of PROCESS v3.0 Model 1
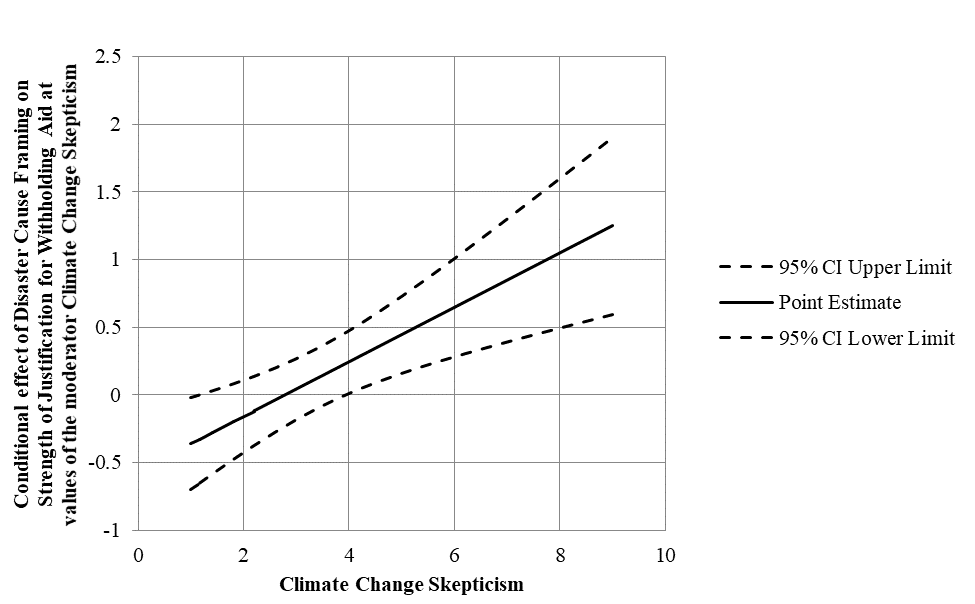
This blog is about graphing moderation with the help of SPSS with the PROCESS macro, and our corresponding MD2C Graphing template for PROCESS v3.0 Model 1 – Moderation.
The case that we used is based on the article of Chapman and Lickel (2016), and you can find a detailed elaboration of this case in Andrew Hayes’ second book about Introduction to Mediation, Moderation, and Conditional Process Analysis (Hayes, 2017). You can download the data from Hayes’ website. The datafile you need for this example is called DISASTER. Besides, you can also download the PROCESS V3.0 macro for SPSS and SAS (and much more) from the site: http://www.processmacro.org/
Continue reading “Graphing moderation of PROCESS v3.0 Model 1”The effect of Stress on Satisfaction and Self-Evaluation
Stress, Satisfaction and Self-Evaluation
This short blog is about exploring the relationships between stress, satisfaction and self-evaluation. For an assignment of the course Introduction to Psychology, I had to gather 20 responses to answer some questions. Due to the huge amount of responses, I thought it could be nice to share the results to thank all of you for your participation. Continue reading “The effect of Stress on Satisfaction and Self-Evaluation”
Graphing conditional indirect effects with the MD2C Excel Template
NOTE: 11 December 2017 – This blog is about the PROCESS v2.16 version. We have also an example with PROCESS v3.0!
This blog is about graphing conditional indirect effects with the help of SPSS with the PROCESS v2.16 macro, and our MD2C Graphing moderated mediation Excel template. Continue reading “Graphing conditional indirect effects with the MD2C Excel Template”
Research Methodology – Descriptive statistics and exploring graphs with SPSS
This blog is part of a lecture about descriptive statistics and exploring graphs with SPSS. Some of the data is of the students themselves, and for other graphs, I used the datasets from Andy Field’s Discovering Statistics Using IBM SPSS Statistics, a book I highly recommend! Continue reading “Research Methodology – Descriptive statistics and exploring graphs with SPSS”
Predictive modeling and human interaction
This blog gives you some reflections on predictive modeling and human interaction.
The prediction…
The nice thing of predictive modeling is that it gives you possible answers, which you could use to define you or your customers’ actions. You can classify things or trying to predict numbers, like your sales. Another nice thing is that you can retrain your models over time to get -hopefully, but not guaranteed- better results. Continue reading “Predictive modeling and human interaction”
Optimizing prediction models on Azure – pruning the trees
This is a simple example about optimizing prediction models on Azure. In this case we will use a Boosted Decision Tree model. We will show you how you can use the Permutation Feature Performance module to prune your trees.
We start with the Student Performance Classifier from a previous blog. We already found out that the Boosted Decision Tree algorithm gave the best results, so we will start with that one to train our model with. Continue reading “Optimizing prediction models on Azure – pruning the trees”
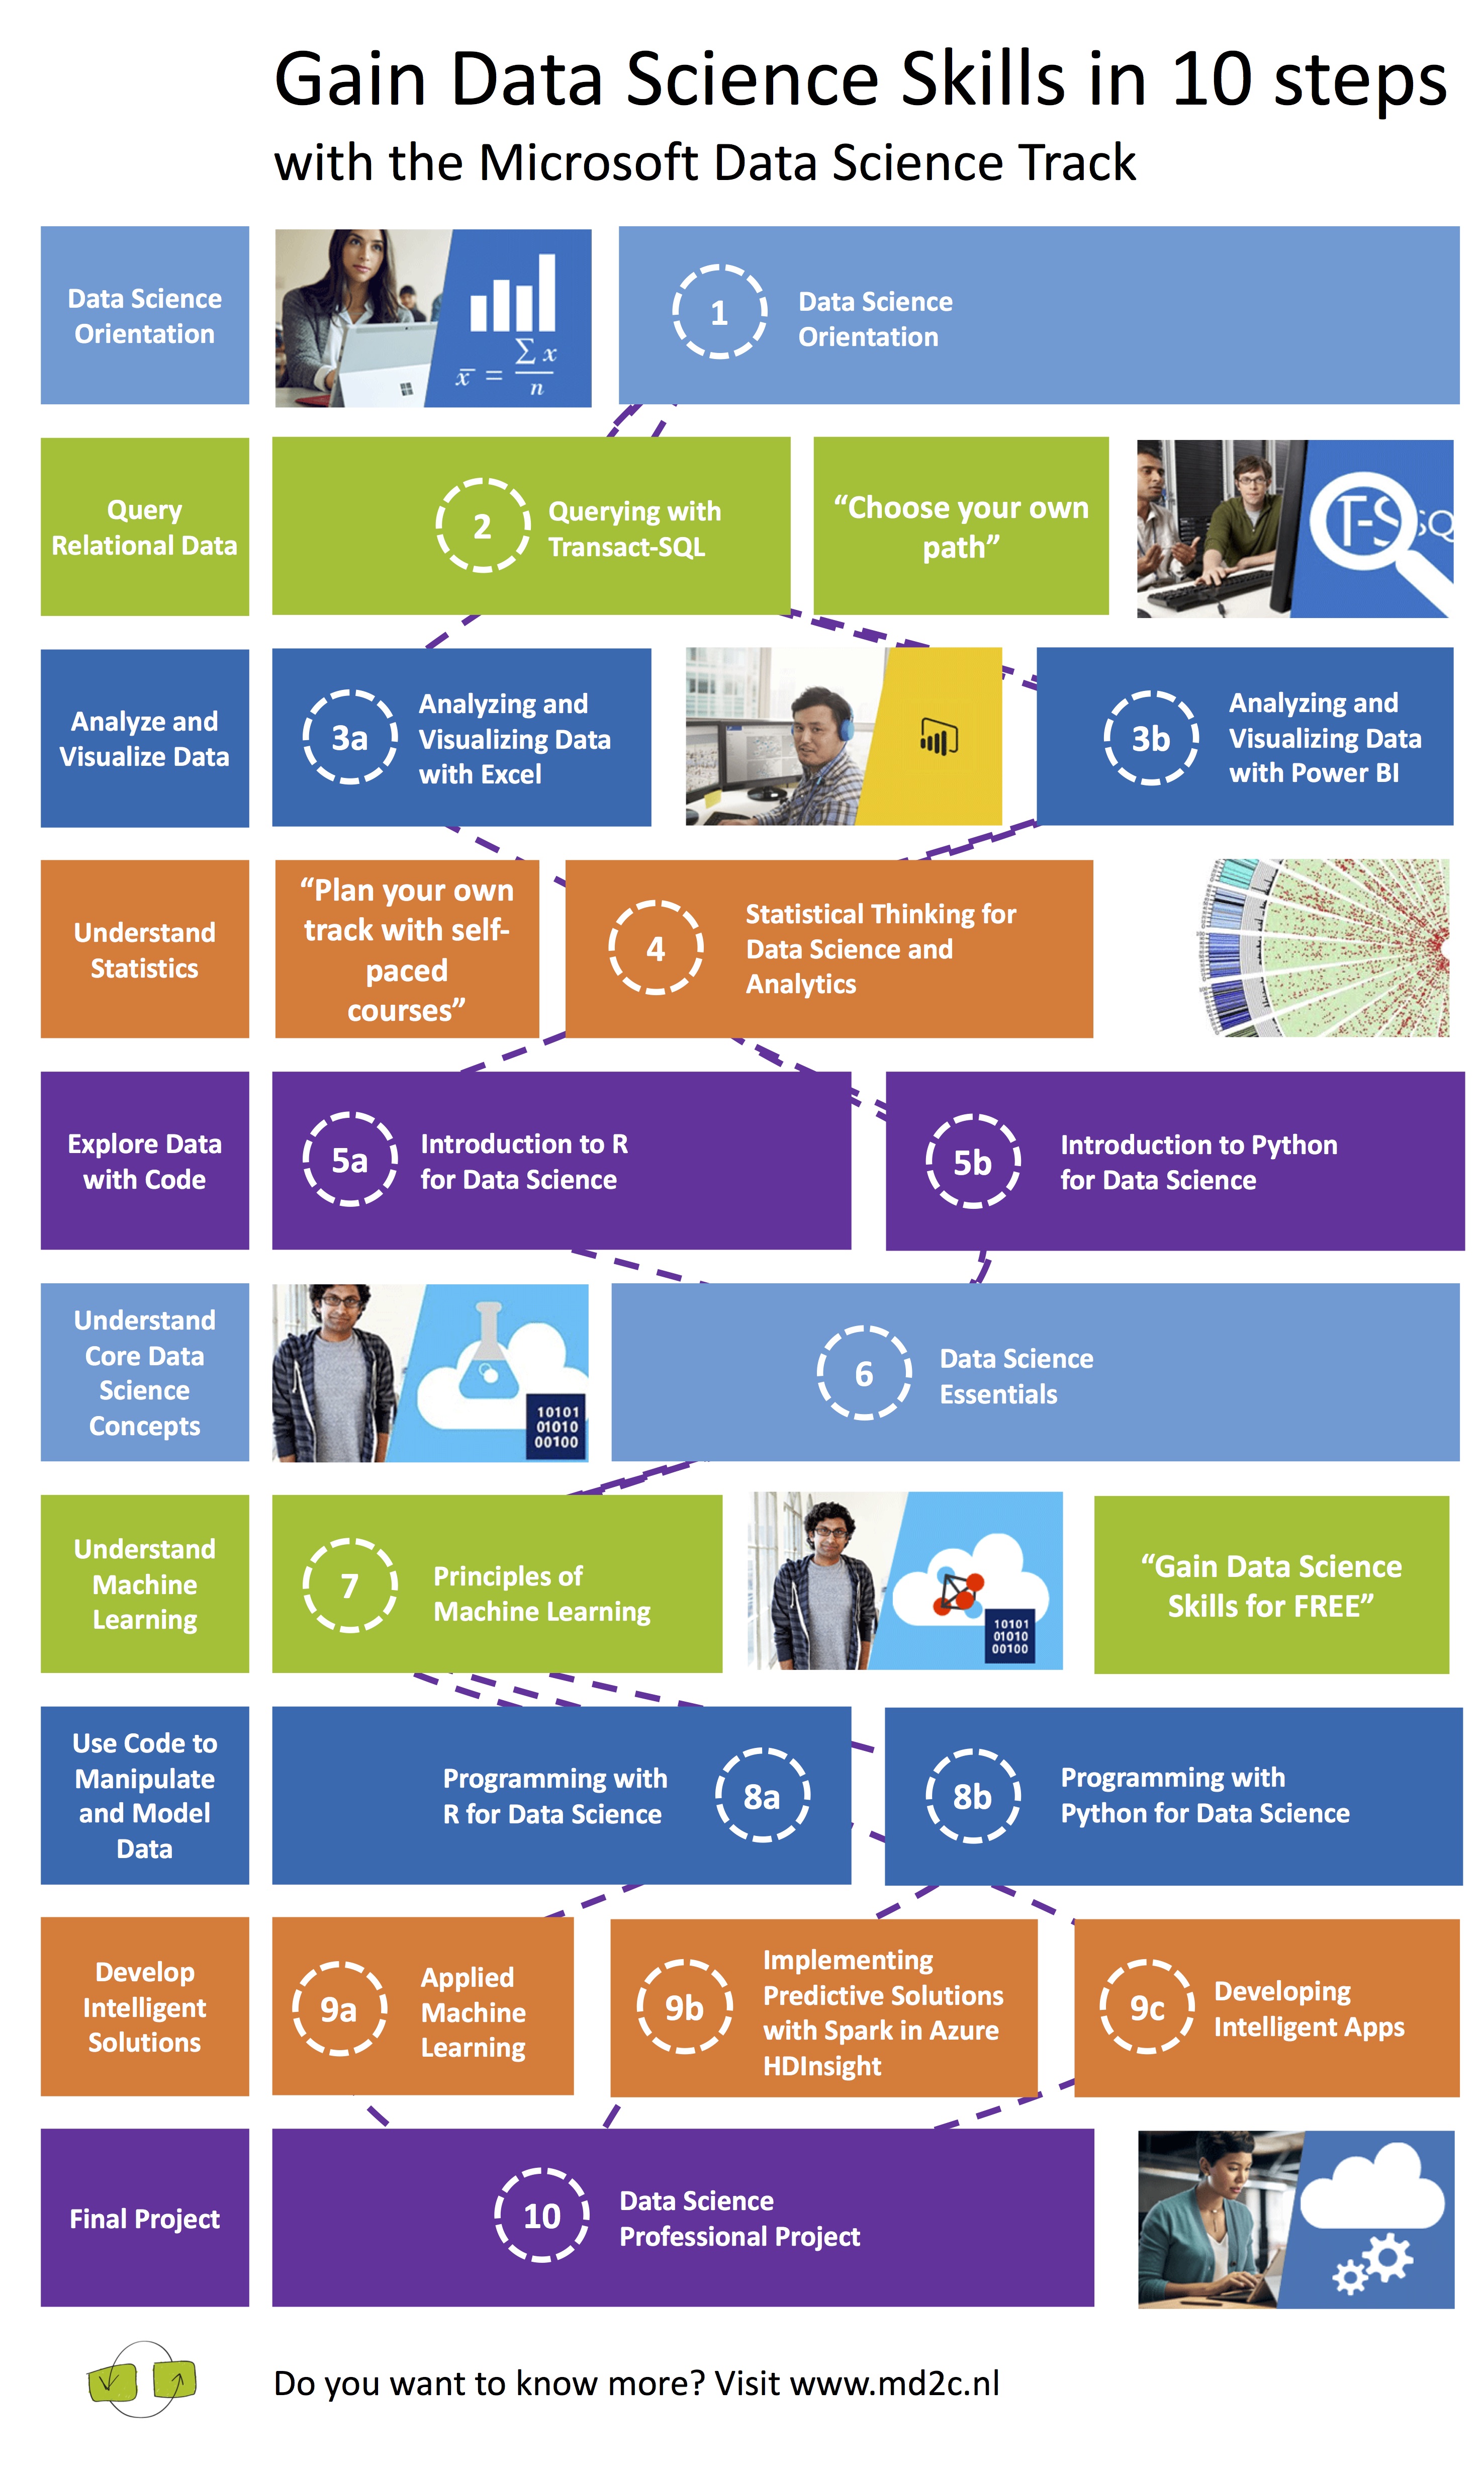
Gain Data Science Skills in 10 steps with the Microsoft Data Science Track
Microsoft has now developed a data science track! You can learn the basics steps of data science, online and for free. These courses form part of the Microsoft Professional Degree Program. There are 10 steps to take, and sometimes you can choose between in example a course which uses R or the one that uses Python. The courses are self-paced, but some do have a starting data. You can find more about these courses on our DataChangers website. Continue reading “Gain Data Science Skills in 10 steps with the Microsoft Data Science Track”


