This blog is about graphing moderation with the help of SPSS with the PROCESS macro, and our corresponding MD2C Graphing template for PROCESS v3.0 Model 1 – Moderation.
The case that we used is based on the article of Chapman and Lickel (2016), and you can find a detailed elaboration of this case in Andrew Hayes’ second book about Introduction to Mediation, Moderation, and Conditional Process Analysis (Hayes, 2017). You can download the data from Hayes’ website. The datafile you need for this example is called DISASTER. Besides, you can also download the PROCESS V3.0 macro for SPSS and SAS (and much more) from the site: http://www.processmacro.org/
In this case, it’s about a group of 211 people that read about famine in Africa caused by the droughts affecting the region. Half of the group got the information that climate change caused the drought, and the other half of the group did not get information about the cause of the drought. This resulted in a variable called “FRAME”, with values 1 for those who received the climate change information, and 0 for those who didn’t get this information. After reading the article, they had to answer to what extent the agreed/disagreed to not help the victims. The score was captures in the variable “JUSTIFY”, representing the strength of withholding aid to the victims. Finally, they got question regarding their belief in climate change, resulting in the variable “SKEPTIC”, representing to what extent somebody is skeptic regarding climate change.
In this blog we are purely focusing on the graphing part. If you would like to know more about the case, we would highly recommend you to read the book.
Prerequisites:
- Make sure you have a current version of SPSS
- Download the PROCESS V3.0 macro and install the macro
- Download the data, unzip the file and open disaster.sav with SPSS
- Get the graphing template
- Get Hayes’ book (2nd edition) Introduction to Mediation, Moderation, and Conditional Process Analysis
To start the analysis, you first have to download the data and install the PROCESS macro. The dataset we are going to use is protest.sav.
This file contains the answers of 211 people, and we are interested in the following columns:
- frame: Experimental condition (information about climate change, or no information)
- justify: Negative justifications (strength of withholding aid to victims)
- skeptic: Climate change skepticism
The model we are going to work with is the following:
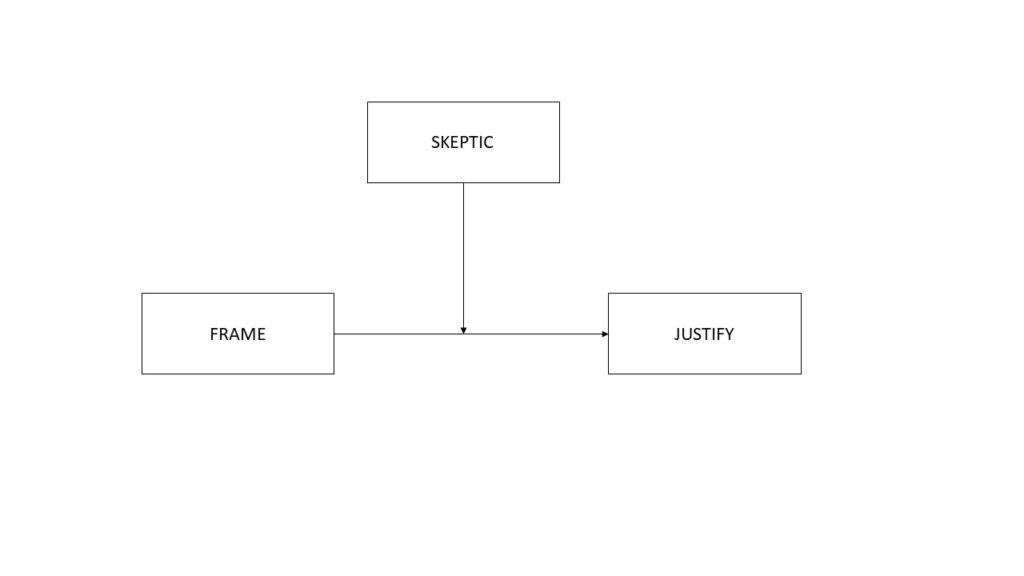
Model 1 – SPSS
We start with finding out whether the effect of framing of the cause of the disaster on strength of justifications for withholding aid is moderated by the people’s skepticism regarding climate change. We do this with the help of Hayes’ PROCESS V3.0 macro and we will use the SPSS output and the corresponding Excel template to visualize the effects.
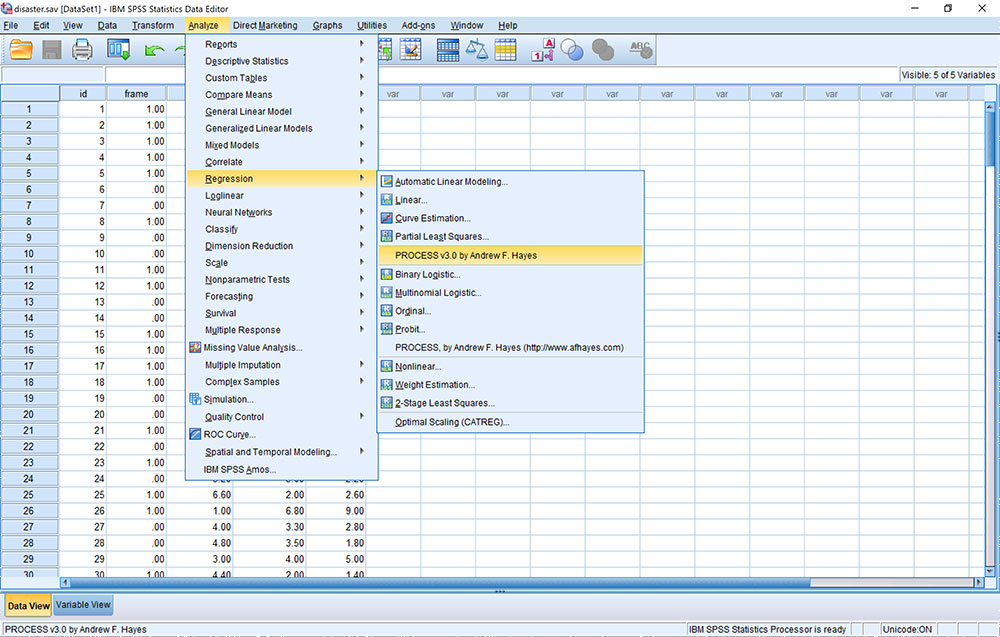
Therefore, we open the disaster.sav dataset in SPSS and go to the PROCESS v3.0 macro (Analyze – Regression – PROCESS v3.0):
Then we select the variables:
- justify as our outcome variable (Y)
- frame as our independent variable (X)
- skeptic as our moderator variable (W)
Furthermore, we chose model number 1 (simple moderation). Besides, we select the option to generate code for visualizing interactions. Finally, we also select the option that we want percentiles, and that we want to use the Johnson-Neyman technique to probe the interaction: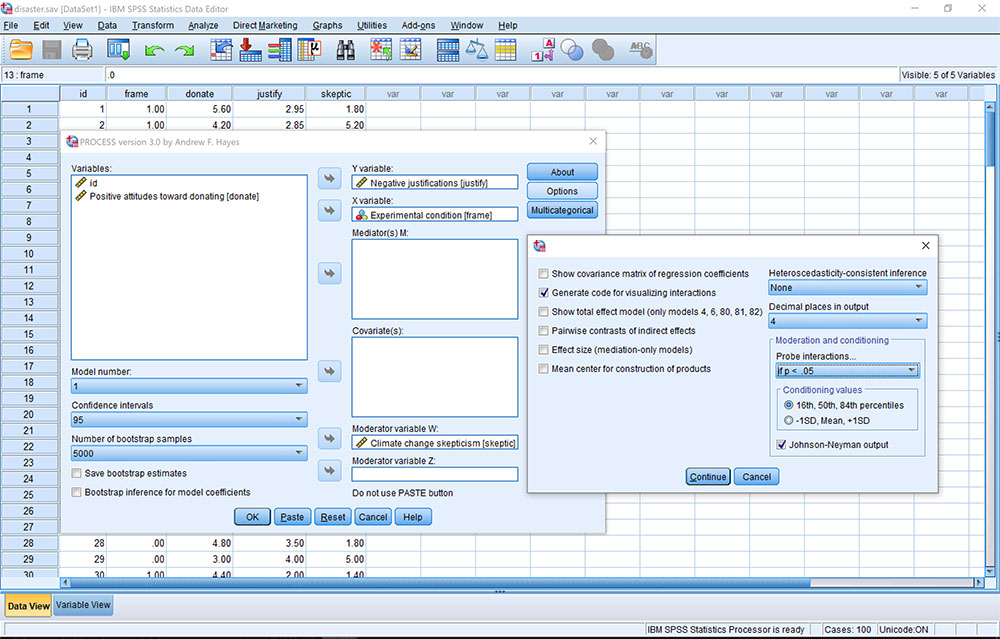
Model 1 – Graphing moderation
The output file from this PROCESS macro will get you all the results you need. First you get the model overview, and you can learn how to interprete the data by reading the book, so we ignore this part and scroll down to the “Data for visualizing the conditional effect of the focal predictor” part:
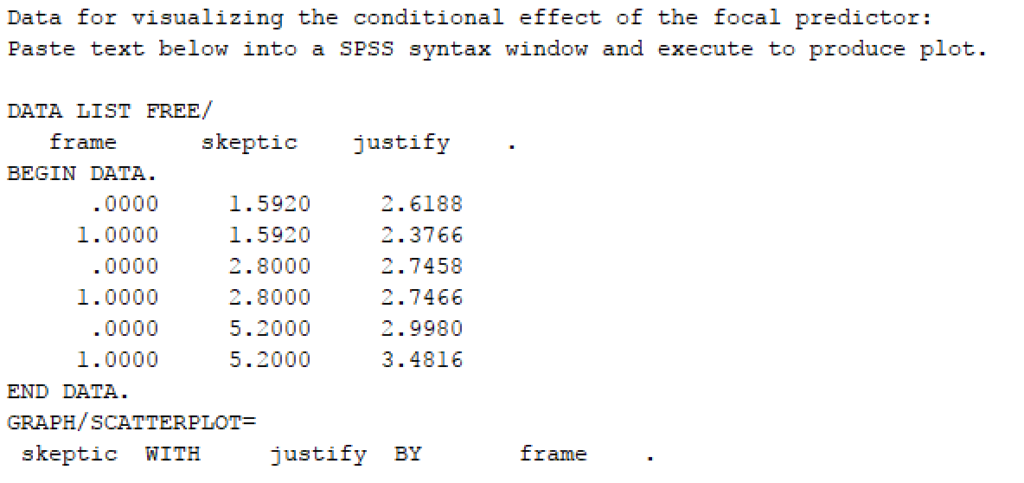
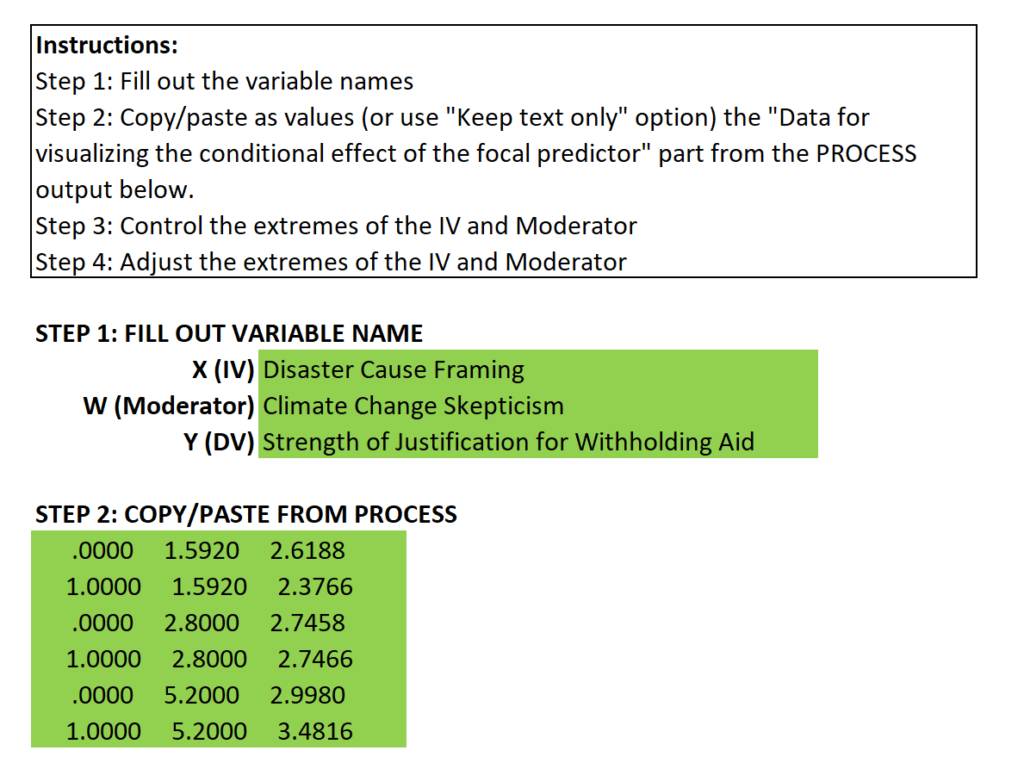
You can now open the Excel template and fill out your variable names, and copy the data part from the above output, and paste the values (“Keep text only” – option) in the green area of the first tab of the template to make a graph.
This will result in the following graph:
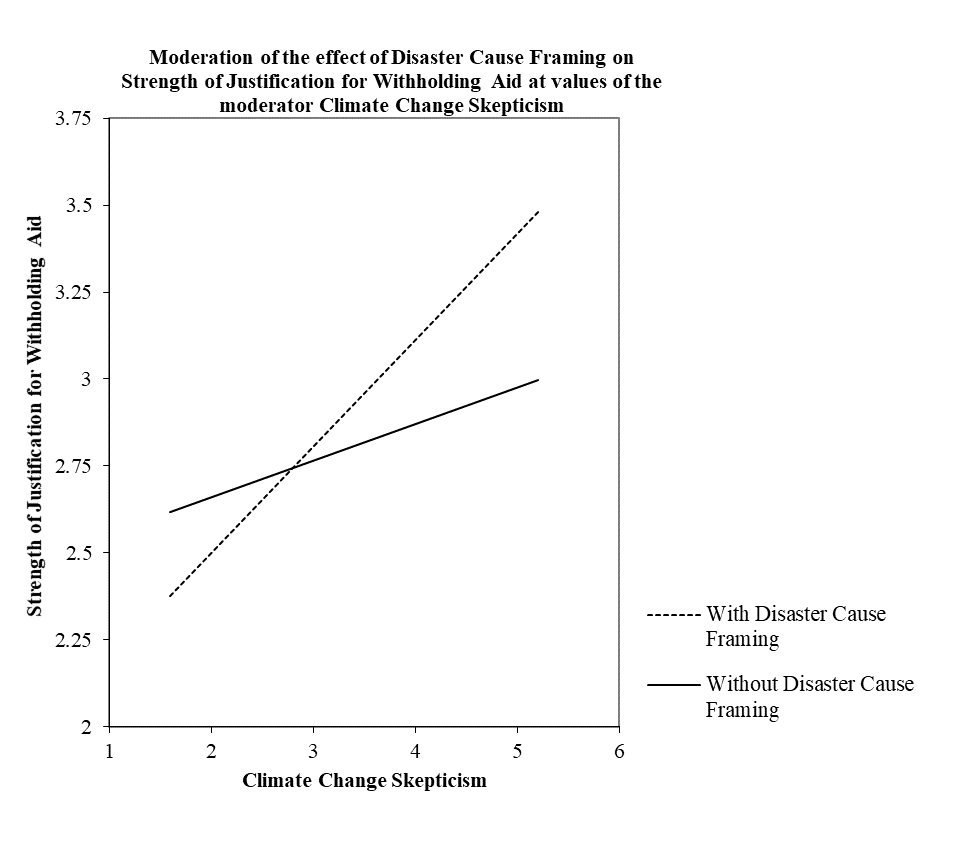
Here you can see that there is a difference between those that were informed about climate change versus those that were not informed, but this effect changes depending on the level of skepticism regarding climate change. However, we don’t know anything yet about the significance of these effects. Therefore, we scroll up in the output file to the part about the conditional effect of the focal predictor FRAME at values of the moderator SKEPTIC:
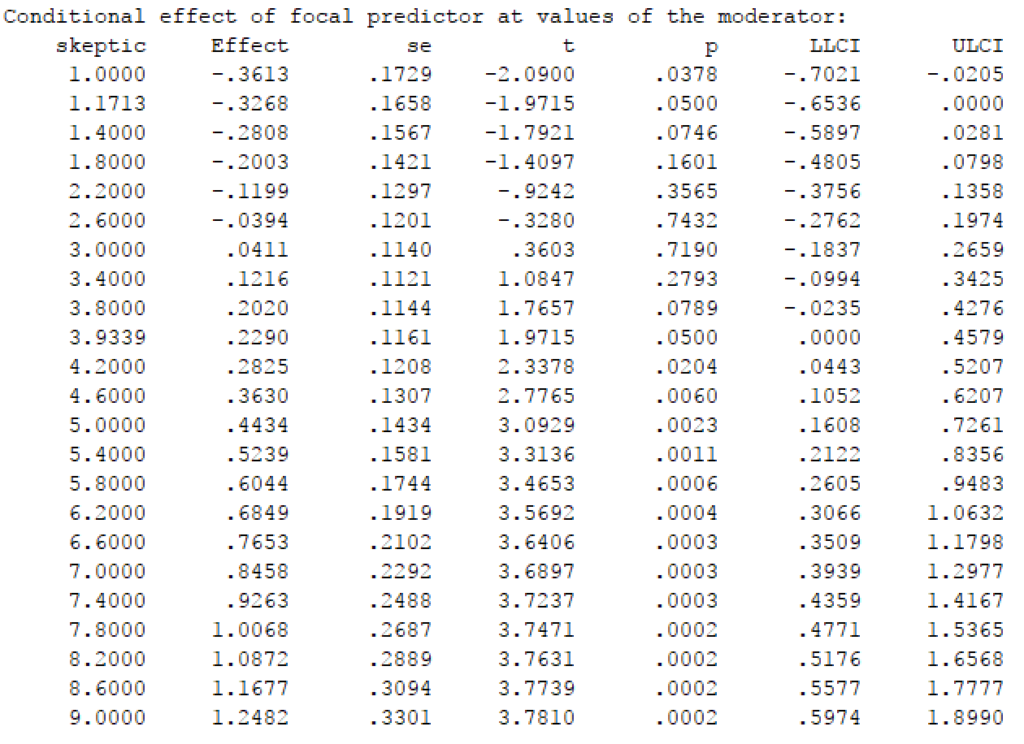
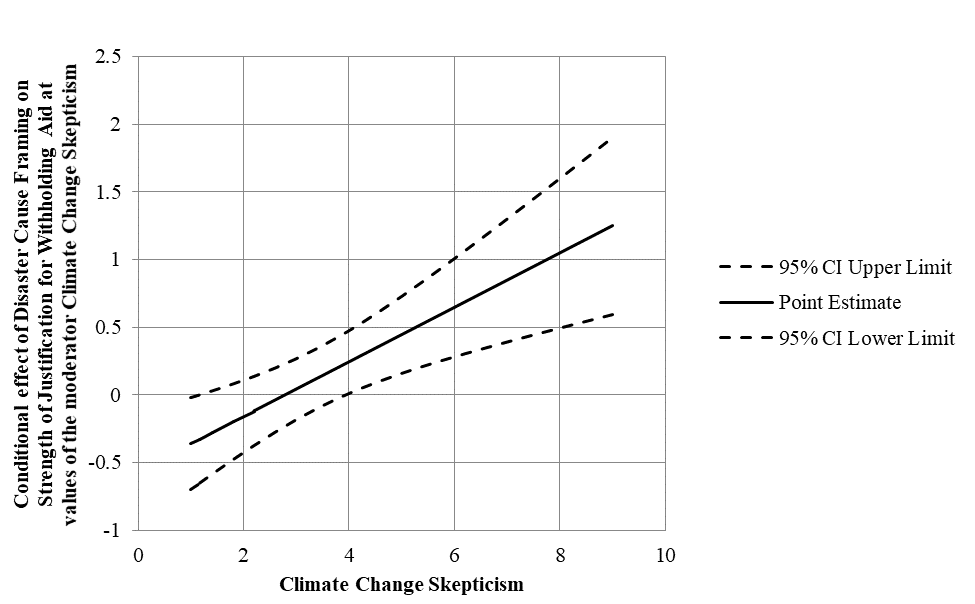
You can copy these data and paste them into the second tab of the Excel template, after you have filled out the variable names:
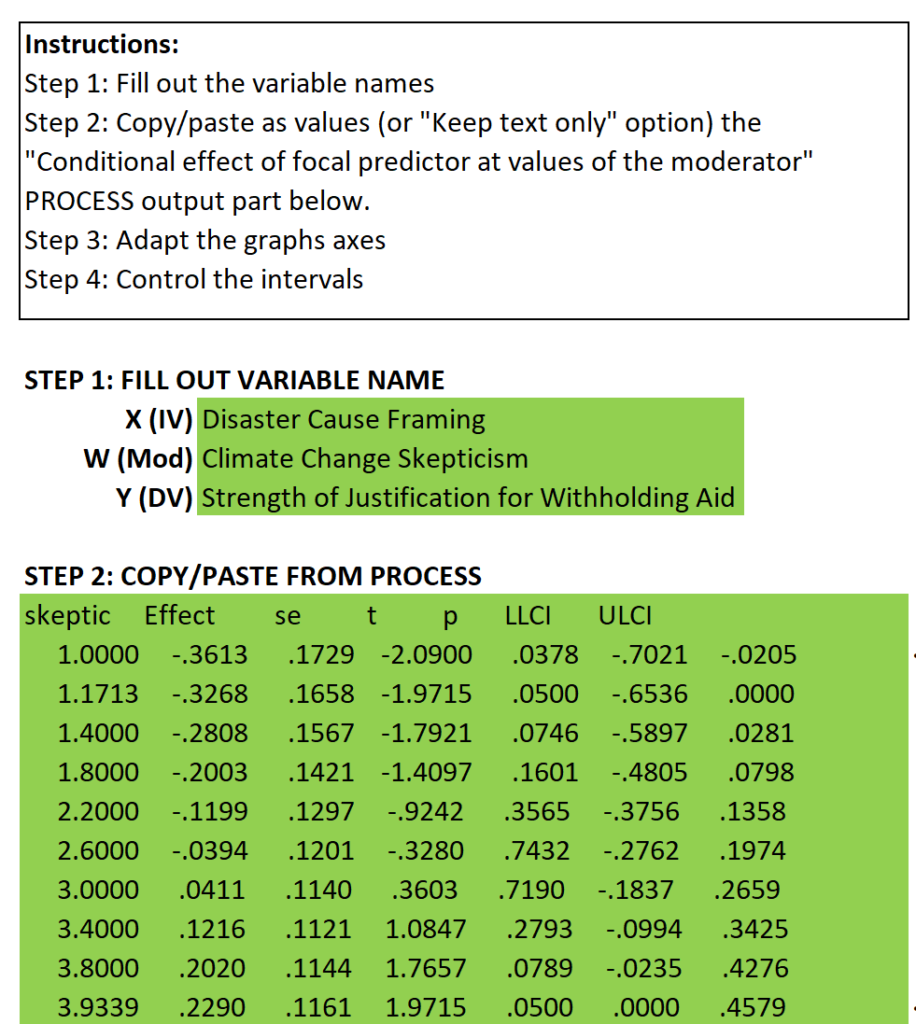
This results in the following graph, which shows you the conditional effect of Protest on Liking at values of the moderator Sexism, including the confidence intervals:
We hoped you found this blog informative, and please let us know your comments! If you would like to see more blogs with in depth explanation about how to interprete the results, please let us know.
If you want to make graphs of other models: we have more templates available in our store!
References
Dawson, J. (n.d.). Interpreting interaction effects. Retrieved from http://www.jeremydawson.co.uk/slopes.htm
DeCoster, J. (2009, 9 14). Graphing moderated mediation. Retrieved from Microsoft Excel Spreadsheets: http://www.stat-help.com/spreadsheets.html
Hayes, A. (2017). Introduction to Mediation, Moderation, and Conditional Process Analysis: A Regression-Based Approach, 2nd Edition. New York: The Guildford Press.


